

Influence of rail and wheel roughness on rolling noise: Measurements and analysis
Posted: 16 November 2017 | Jesús Otero Yugat - Field Test Engineer at CETEST | 2 comments
Roughness of the rail and wheel running surfaces produce rolling noise – the most significant form of noise due to wheel-rail contact. Rolling noise from conventional metro trains, tramways, streetcars, electrical or diesel multiple units and even high-speed trains is a key consideration during the design, homologation and testing phases; and rail and wheel roughness forms an intrinsic part of the examination. CETEST has extensive experience in rail and wheel roughness measurement and analysis, which has been gleaned during the course of several projects around the world. For Global Railway Review, Jesús Otero Yugat, Field Test Engineer at CETEST, explains further.

Wheel and rail roughness are characterised by the undulations of the surfaces. When the wheels turn the undulations produce vibrations of a particular wavelength – and therefore noise. In terms of rolling noise, important wavelengths of roughness are focused in the range of 5mm to 500mm, with amplitudes from tens of microns at long wavelengths to less than a micron at short wavelengths1. Evidently, this kind of roughness is not visible to the human eye and would appear as a smooth surface. Longer wavelength roughness excites lower frequencies and are not significant for rolling noise; instead they are relevant to ride comfort and ground vibration.
From the point-of-view of applicable standards – ISO 3095:2005 and ISO 3381:2005 for exterior and interior noise respectively – the requirement of rail roughness measurements through direct or indirect methods is specified. Moreover, the European Commission – through the European Union Agency for Railways (previously known as the European Railway Agency (ERA)) – included in 2011 a new procedure to assess acceptable small deviations from rail roughness requirements. This procedure was included on the technical specification document of interoperability relating to the subsystem ‘rolling stock – noise’ of the trans-European conventional rail system (TSI 2011/229/EU). Later it was added as normative in the updated version of the international standard ISO 3095:2013 and in the current version of the technical specification document (TSI document 1304/2014). This background highlights the importance of the roughness analysis.
However, there is currently no industry standard for the evaluation of wheel roughness. Nevertheless, there is a proposed methodology for the analysis as part of the ACOUTRAIN European Commission FP7 research project (Virtual certification of acoustic performance for freight and passenger trains).
This history of roughness analysis and measurement is well known by CETEST. Roughness measurement campaigns have been carried out in several international projects in all continents of the world. Analysis of the recorded signals is not limited to verifying the comparison of the obtained roughness with the limit spectra defined by the standards for one third octave normalised wavelength bands. Results are also used for characterising the roughness contribution to the rolling noise.
Measurements and experimental data
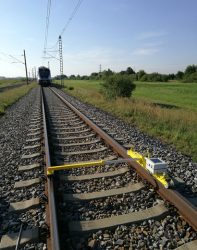
Figure 1: Rail surface analyser
A rail surface analyser is used for rail roughness measurements. This equipment has three displacement sensors with an encoder. The analyser is guided through the track available for the tests at a speed lower than 1m/s. Four channels are recorded: signals from the encoder and the three sensors. These signals are acquired by means of an analogue-to-digital converter with a resolution of 16 bits (see Figure 1).
The measurement setup for wheel roughness measurements is very similar. On one side of the wheel, three displacement sensors are placed perpendicular to the wheel surface. The wheel roughness is measured on three parallel lines, with a separation of 1cm. On the other side of the wheel, a rotary encoder measures the travelled distance. A minimum of eight revolutions of the wheel are measured and Figure 2 illustrates this instrumentation.
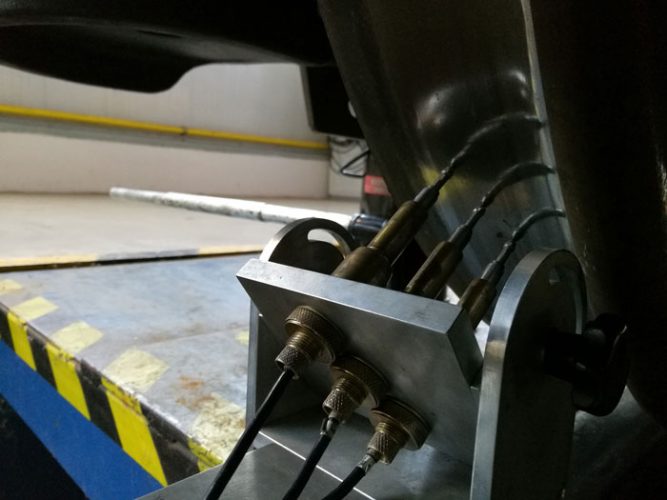
Figure 2: Measurements
of wheel roughness
Analysis and results
Once all the data are acquired, the next step is to analyse the roughness according to the procedure defined by the standards and applicable documents. Figures 3 and 4 illustrate respectively results of rail and wheel roughness obtained during a test campaign of an electrical multiple unit in Europe.
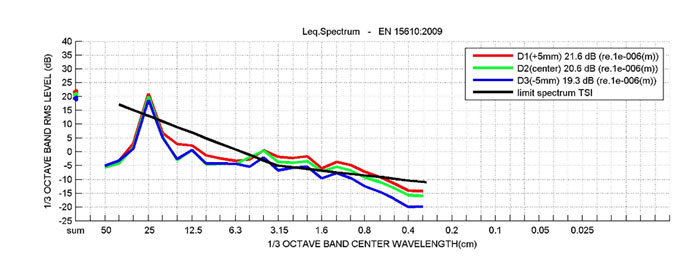
Figure 3: Roughness spectrum of a rail compared with the limit spectrum
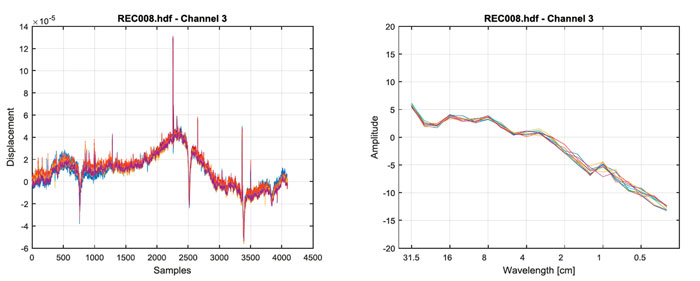
Figure 4: Measured displacement at the wheels and corresponding wavelength spectrum
The next step evaluates the roughness contribution to the rolling noise. The obtained wavelength spectra are converted to narrow frequency band spectra and the corresponding on third octave frequency band spectra is then synthesised. The relevant frequency range of rolling noise is train-speed dependent but is considered to be between 100Hz and 5kHz. At higher frequencies, the noise contribution is reduced and at low frequencies aerodynamic noise is dominant. In addition, the A-weighting curve attenuates significantly at low frequencies. Therefore, the mentioned frequency range is sufficient for the analysis.
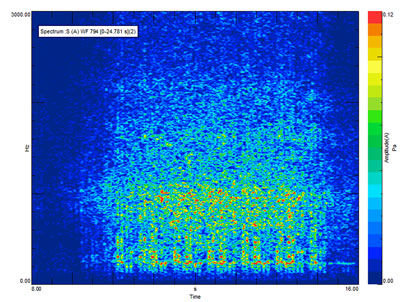
Figure 5: Spectrogram
of measured exterior
pass-by noise levels
Using the recorded pass-by sound pressure levels measured at the exterior, a spectrogram or time-frequency diagram can be obtained. Figure 5 shows an example of a test performed with a train speed of 80km/h. It can be observed that the energy is contained between the frequency range of 140Hz-1640Hz which corresponds to a wavelength range of between 0. 159m and 0.014m. This range is related to the maximum values of roughness obtained in the normalised one third octave bands located between 0.160m and 0.010m. It is therefore verified that the track roughness has a direct impact on the measured sound pressure levels. This analysis is performed for one pass-by noise measurement at each test speed.
A corrected rail roughness spectrum is calculated considering a spectrum equivalent to the measured one, except in the wavelength bands where the measured spectrum exceeds the limit, as is explained on the small deviations method detailed on the standards.
Taking account of the determined wheel roughness and corrected rail spectrum, a combined wheel-rail roughness is obtained for each wavelength band. Hence, a corrected pass-by noise spectrum is evaluated for each tested speed. This corrected pass-by noise spectrum is the minimum that might have been measured with a just compliant roughness spectrum.
Conclusions and final remarks
Rail roughness is part of the homologation process during an acoustic test campaign. Nevertheless, the evaluation of the rolling noise is an important issue. In addition to the rail, the wheel roughness can be measured and analysed. Both results are useful tools for the characterisation of rolling noise and their contribution to the overall sound pressure levels emitted due to the passage of a train.
CETEST – as a leader in railway testing – goes beyond measurements, providing solutions for the analysis and know-how helping its customers during each phase of a project.
References
- According to D. Thompson in ‘Railway Noise and Vibration. Mechanisms, Modelling and Means of Control’
Biography
JESÚS OTERO YUGAT holds a Ph.D in Mechanical Engineering, Fluids and Aeronautics from the Polytechnic University of Catalonia, Spain. He is responsible for the projects developed worldwide by CETEST in terms of acoustics, noise and vibration research and testing for different vehicle types, ranging from LRVs to high-speed trains. He has published several scientific articles in this field.


Hello Bruce. Thank you for your comment and feedback!
In the US there is a lax attitude toward maintaining smooth surfaces in this regard particularly concerning flat spots arising from locked-wheel skids. In 2008 I was shocked to hear from conductors on trains in England that they are required to report flat spots immediately, by radio or phone, as soon as they become evident. The phenomenon of square wheels takes a huge and unquantified toll in maintenance costs and damage to rolling stock, tracks, bridges and other foundations for a wide radius around. The best way to address it would be some form of propulsion and braking that does not involve wheel adhesion.