

SFOORTI: an analytical tool to improve rail freight operations in India
Posted: 22 August 2022 | Ramon Arora | 1 comment
Raman Arora, Principal Project Engineer in the Centre for Railway Information Systems (CRIS) – the IT arm of India’s Ministry of Railways, explains how the Smart Freight Operations Optimisation and Real-Time Information (SFOORTI) solution is a useful digital platform for the planning, allocation, coordination, monitoring and analysis of Indian Railways’ freight operations, assets, and business.
It is generally acknowledged that transportation networks are the life and soul of modern societies, as they not only ensure the well-being of individuals, but also foster economic growth. In India, a modern and cost-efficient transport and logistics infrastructure network is the crucial cog on which its vaunted ambition of becoming a global manufacturing destination rest. It is impossible to imagine such a network without the country’s transportation behemoth, Indian Railways. Owned and operated by the Government of India, Indian Railways is the world’s fourth-largest transportation and logistics network and is the lifeline of the nation. Being an integral part of India’s logistics ecosystem, Indian Railways plays a vital role in facilitating trade and business in the country. Indian Railways’ freight operations entail the management of a fleet of more than 330,000 wagons, 12,000 locomotives, and the running of 6,000 freight trains daily. During the financial year 2021-2022, Indian Railways has recorded a loading of 1,400 million tonnes generating a revenue of around $20 billion. Freight trains earn two-third of Indian Railways’ revenue and are referred to as bread earners for the railways. Unlike passenger trains, freight trains in India do not run on fixed schedules, making freight operations a highly information-intensive activity which needs continuous monitoring of running of freight trains and other operational aspects.
Through this technological innovation, Indian Railways is vying to improve its operational efficiency and consequent competitive advantage in the logistics domain.
Indian Railways is facing stiff competition from other modes of transport, such as roadways and airways, like never before. In today’s highly competitive environment, managing logistics functions is a key determinant of overall business performance and technology plays an indispensable role in that front. Information sharing on real-time basis is imperative for the improvement of business efficiency and effective decision making. In pursuit of adopting technology to fuel its operational planning, coordination and business monitoring, Indian Railways envisaged a tool which shall help operating managers carry out their routine plannings and allocations more effectively and will facilitate apex management to monitor the freight business quickly and categorically.
The Centre for Railway Information Systems (CRIS), the IT arm of Indian Railways, has designed and developed a cutting-edge IT solution named Smart Freight Operations Optimisation and Real-Time Information (SFOORTI) to provide access to freight business information and related operational aspects on real-time basis. State-of-the-art interactive dashboards, geographic information system (GIS) enabled views and graphical presentations of real-time activities, demonstrate key business aspects in a unique, elegant, and informative way to facilitate easy information grasping and quick analysis. Through this technological innovation, Indian Railways is vying to improve its operational efficiency and consequent competitive advantage in the logistics domain.
Distinguishing features of the SFOORTI application
The expansive network, complex blend of functions, and matrix nature of the Indian Railways require it to be managed in a multi-layer system, with the whole of Indian Railways divided into 17 zones and those zones into 71 divisions. SFOORTI has been designed to provide freight business information distinctively for user’s respective territory and also a holistic view of the entire Indian Railways. Application is available to three sets of users: Divisional users for planning, coordination and control in respective divisions, Zonal users for monitoring assets and KPIs in respective zones and for Indian Railways users, presenting a holistic view of entire Indian Railways territory. With their designated credentials, users may login securely and access the information made available through various data sources. Facility for drilling-down to zones, divisions and to stations is also available for deeper insight. Real-time data integrations in Indian Railways’ digital landscape, such as the integration with Indian Railways’ Crew Management System, Parcel Management System, Integrated Coach Management System and National Train Enquiry System helps in an exhaustive and broad analysis of operations across Indian Railways. All data integrations are secured and automated without any manual intervention, thereby providing reliable and just-in-time information.
SFOORTI consolidates various aspects of operations and business performance and arranges them on a single screen in the form of dashboards. These dashboards use advanced visualisation techniques such as interactive widgets, filters, charts, graphs, and tables to present information over multifarious attributes.
The GIS enabled views valorise the operational data to provide insight through spatial analysis of zonal and divisional territories. The derivative and interpolated information presented through these views assist in effective planning and efficient decision making. Aspects like congestion monitoring, real-time positioning and forecasts presented through GIS, help in gaining actionable intelligence.
The distinguishing features of the application are as follows:
Performance dashboards
SFOORTI dashboards present a comprehensive view of operations and business KPIs for a period and offer the comparison of it with reference to the corresponding period of the previous year. This helps in understanding leads and lags with deep information insight. Period of analysis can be customised using date range filters.
KPIs dashboard
The dashboard presents operating indicators to assess the performance of divisions and zones over the four aspects: Wagon Turnround (average period of time in which a wagon is available for next loading after completing one loading cycle), Traffic Lead (average distance for goods transported), Net Tonne Kms (NTKM) and average speed of freight trains for different types of wagons and commodities with comparative analysis for the selected period vis-à-vis corresponding period of previous year. Analysis can be done for individual zones and can further be drilled down to the level of divisions.
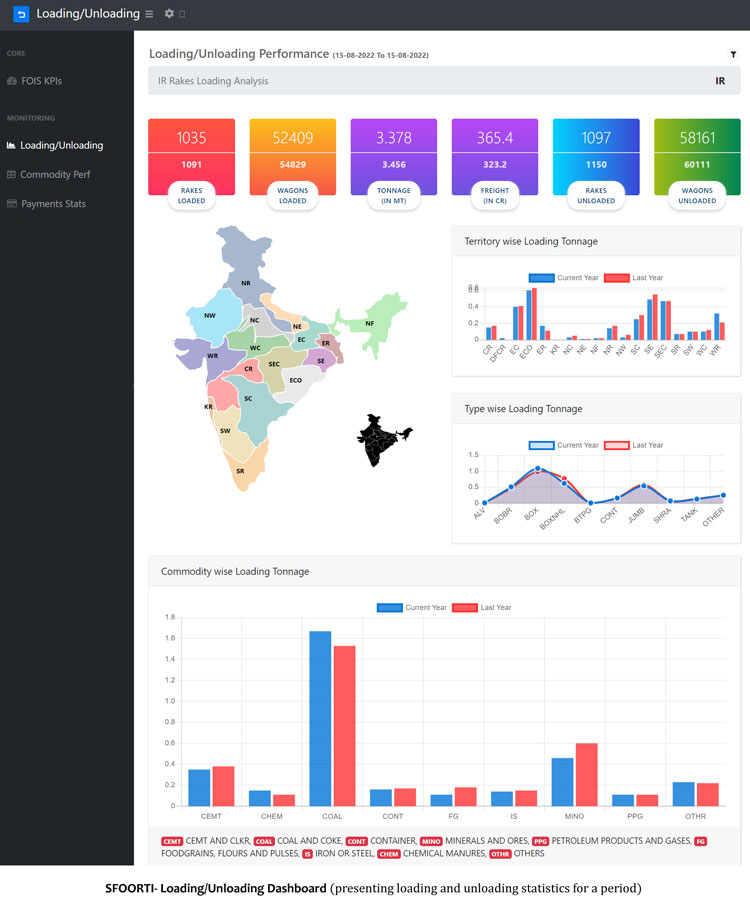
Loading/Unloading dashboard
This dashboard presents the Loading/Unloading statistics for Indian Railways over a period of time including total loading in million tonnes, number of freight trains loaded, wagons loaded, freight earnings, number of freight trains unloaded, and wagons unloaded. Having presented a bird’s eye view at all Indian Railways levels, zonal or divisional level, the view also provides drill-down facility to get deeper insight and helps identify potential gaps or leads. The dashboard also offers breakup of the loading/unloading for different commodities (Coal, Minerals, Food Grains, Iron and Steel etc.) and types of wagons (tank wagons, box wagons etc.) in order to assess the trend of traffic.
Commodity performance
An analysis of commodity wise loading performance is essentially required to formulate an effective marketing strategy for a specific commodity. This dashboard provides comprehensive analysis for user selected commodity(s) such as loading statistics for a period, unloading statistics, period-on-period trend, outstanding indents statistics. This view also presents current and odd hours availability of rakes loaded with specific commodity and ETA insight for trains presently on move.
Payments statistics dashboard
This provides statistics of freight collection through different modes of payment, such as online payment, e-payment (auto debit from customer’s account) and offline payment (demand draft, cheque etc.). Zone-wise and division-wise analysis is also available to monitor the payments trend.
Map (GIS) views
SFOORTI stands by the Government of India’s highly ambitious ‘Make in India’ initiative by making use of mapping solutions developed by the Department of Space with the Government of India. Collaboration on technology between Indian Railways and the Department of Space in the geospatial domain has brought advancements in the way information is made available. This promising GIS technology powers SFOORTI to present just-in-time access to freight information in a way which is easily and immediately comprehensible.
Loads On Run GIS view
This view presents the real-time snapshot of the freight trains, passenger trains and parcel trains moving over the Indian Railways territory. For quick identification, these trains are highlighted with different colour codes. Users can easily view the detail of each train such as its origin, destination, current status, expected time of arrival at destination, coach composition etc. by clicking on its position on the map. The complete journey of any train can also be monitored through the same view. The user has a facility to customise this view through a number of filters available. This holistic snapshot of Indian Railways’ network occupancy is generated as a result of secure data integrations and real-time data exchange from Indian Railways’ Integrated Coach Management System and Parcel Management Systems.
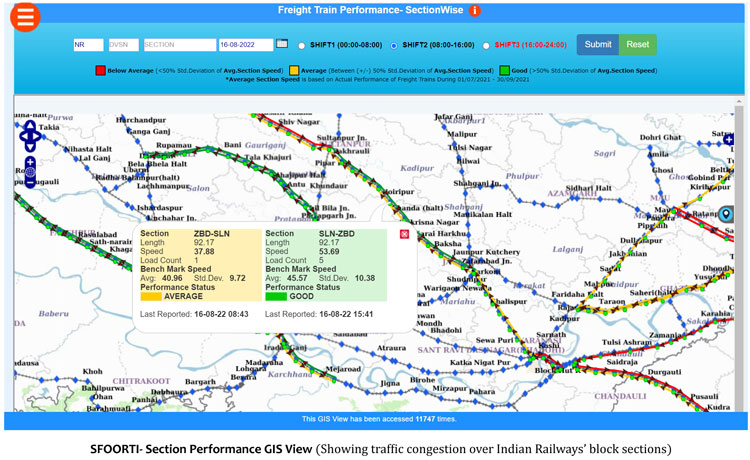
Section Performance GIS view
Traffic congestion over Indian Railways’ block sections can easily be ascertained through this GIS view. Current traffic speeds within a section are compared to the benchmark indices, derived through advanced analytics to reach out to the current level of congestion over a section. Accordingly, each block section over the Indian Railways network is plotted in different colour schemes to indicate below average, average or good, helping to monitor network clogs and act as an effective input towards route optimisation.
Stock Position GIS view
This view presents the geographical positions of all the freight trains comprising of specific types of wagons moving over the Indian Railways network. For easy identification, loaded and empty trains are highlighted with different colour schemes. Train composition, cargo detail and movement trail can also be accessed on the screen for each freight train. Traffic insight gained through this view helps in effective planning and allocations for other outstanding indents at terminals.
Commodity Position GIS view
Ensuring the uninterrupted movement of perishable and essential commodities is of prime importance to Indian Railways. This real-time snapshot of freight trains carrying specific commodities, with detained trains highlighted for prompt information, helps in planning, allocations, and timely delivery of consignments. The details of each train with its complete journey trail can easily be accessed through the view.
Expected Traffic at Major Interchange Points GIS view
Interchange points are the boundary terminals of a division or zone at which freight-in-transit is handed over to the next divisional and/or zonal territory. At interchange points, freight traffic needs to be regulated in order to maintain the symmetric route and equalisation of traffic in both directions. The Expected Traffic at Major Interchange Points GIS view helps assess the movement of traffic and expected flow through interchange points during a selected period. The view helps in getting deep insight of the traffic flow so that necessary actions (such as diversions) can be taken immediately.
Crew Availability GIS view
Loco Pilots (drivers) and Train Managers (guards) are the crucial resources for carrying out freight trains operations. Their availability status across various crew lobbies is a piece of desired information that Indian Railways’ freight managers continuously seek. The Crew Availability GIS view helps provide this information across different crew lobbies over Indian Railways. All the crew lobbies are geo-plotted on a map and provide the detail of pilots and guards available at that point of time. The information is obtained on real-time basis from the Indian Railways’ Crew Management System via secured data exchange.
New Origin-Destination (OD) Pairs GIS view
A diligent analysis and insight of new traffic destinations facilitates planning and resource allocation decisions. This view presents a geographical flow of traffic between entirely new OD pairs, added to the Indian Railways’ freight transportation network during a selected period. The detail of new traffic such as type of traffic, commodity and route followed leads to the comprehensive evaluation.
Yearly Traffic Analysis view
Commodity traffic gained or lost for a zone or division is made available through this view. Statistics of freight handling during a selected period vis-à-vis the corresponding period of the previous year on revenue basis and on loading tonnage basis is available for analysis. Graphical presentation of five years of traffic trends adds to the broad evaluation.
Parichaalan (aka Operations)
Parichaalan presents a group of graphical views presenting real-time snapshots of freight operation activities over the Indian Railways network. The module acts as a decision support system assisting operating managers assess just-in-time information on multifarious attributes.
Interchange Monitoring
This provides a deep insight of traffic flow through zonal and divisional interchange points with detail of traffic already crossed and the traffic forecasted for the day. Attention points needing intervention are also highlighted.
Current Train Running
This presents a real-time snapshot of traffic, flowing across block sections of a division with drill-down detail.
Loading
Loading snapshot across zones and divisions on wagon-type basis and on commodity basis as of yesterday, and also details of today’s forecast.
Live Terminal
This is a real-time snapshot of terminal occupancy and handling (loading, unloading), which helps in optimum utilisation of terminal and freight operations resources.
Power Planning
This view presents the real-time snapshot of freight trains without locomotives and the availability of locomotives in a divisional territory, assisting in planning and assignment.
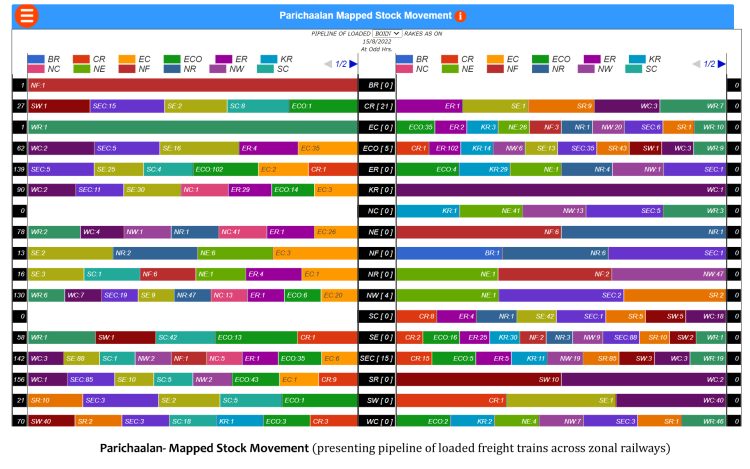
Mapped Stock Movement
This provides a holistic view of the traffic moving across different zonal railways comprising specific types of wagons, helping to regulate and equalise the traffic flow.
Enabling freight managers to take more informed decisions
the application is acting as an enabler for freight managers to take informed decisions and drive the operations and business more effectively and efficiently.
With information available in a modern and easily comprehensible way, SFOORTI is being actively used as a digital platform for planning, allocation, coordination, monitoring and analysis of Indian Railways’ freight operations, assets, and business. Many of the processes which hitherto required the collation of information from various resources have now been served through a single platform and get assimilated immediately through its unique presentation. Thus, the application is acting as an enabler for freight managers to take informed decisions and drive the operations and business more effectively and efficiently.
 Raman Arora has more than 17 years of experience in the field of ICT applications and e-Governance solutions. He has played a key role in digital transformation of various aspects of Indian Railways Freight Business operations along with a number of G2B, G2C and G2G data integrations. He has developed several dashboards, decision support systems, GIS, web, and mobile applications. He has a MBA in Technology Management (IIT Delhi) and B.Tech. in Computer Science and Engineering. Views presented in this article are personal.
Related topics
Apps, Cargo, Freight & Heavy-Haul, Digitalisation, Operational Performance, Rolling Stock Maintenance, Safety, Security & Crime Management, Technology & Software
Related organisations
Centre for Railway Information Systems (CRIS), Indian Railways


Really Knowledgeable.