Integrating insights from asset data in fleet maintenance processes
Posted: 13 November 2017 | Lineas | No comments yet
For Global Railway Review, the asset management organisation team behind Lineas – one of the largest private rail freight operators in Europe – provide details of how usage patterns of locomotives can help to optimise maintenance and how Lineas is equipping its fleet with data and IoT solutions to be future-ready.

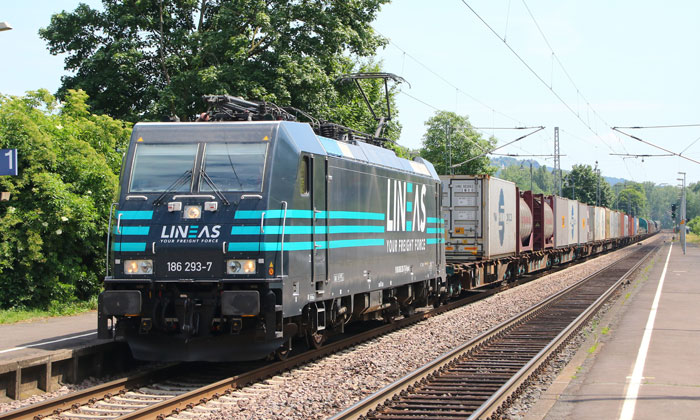
Lineas – a privately-owned European railway undertaking specialised in freight transport – originates from a rigorous reorganisation of the former state-owned B-Cargo. Lineas has a railway licence in five European countries and operates 200 (inter)national freight trains daily. For its operations, Lineas uses 200 locomotives, of which 150 are in ownership, and operates an owned fleet of 6,700 railcars. Lineas’ mission is all about realising the modal shift. To make this happen, Lineas has developed its own unique and innovative rail solution: Green Xpress Network (GXN), offering direct, fast and reliable rail connections between industrial hubs in Europe.
To support the development of its GXN, Lineas established an asset management organisation focussed at maximising both the return of its assets, as well as the value proposition towards clients of its GXN.
Data as a lever for optimised asset management
In January 2017, Lineas launched a pilot project with data scientists from two Belgian start-ups, oriented at using data to optimise its locomotive maintenance management. The project explored the benefits of combining data science with data analytics and data visualisation. The study object: 110 shunting locomotives (with an average age of 16 years) right before their midlife revision. Four different data sources, ranging from old-school massive and multiple excel files, ERP SAP exports, to state-of-the-art near real-time sensor data were used.
Each locomotive emits a signal every 10 seconds that encodes a large set of data such as: the locomotive’s ID number; a time-stamp; a geo location; an operational state; the distance travelled; the rpm; indication of the fuel consumption; and a multitude of other component sensors. The ERP system of the maintenance supplier captures data related to the failures and their diagnostics, the interventions, the type of maintenance and other maintenance related parameters, while an operational follow-up in excel details the trainloads pulled, the trajectories ran and other usage information.
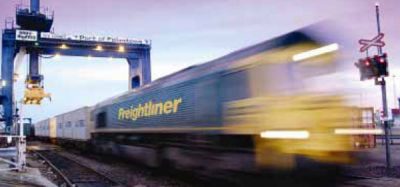
Delivering a modal shift: Lineas’ unique Green Xpress Network (GXN)
Can the usage pattern of the locomotives help to optimise maintenance?
The following central question was put forward when looking at this data: Could a usage pattern analysis of the locomotives help to optimise their maintenance cycle? This usage question was pushed forward for two reasons. Firstly, even though the current maintenance plan does consider certain usage patterns, it does this on a fleet level basis without any distinction on a unit level. Secondly, Lineas operates the shunting locomotives in rather heterogeneous conditions. The locomotives are used in port areas, in coastal areas and in the Belgian Ardennes for long-haul trajectories coupled in double or triple traction, short-distance last-mile activities and in shunting yards.
The hypothesis was that shifting to a set of different usage indicators on a unit level should allow a divide of the fleet into subgroups, allowing them to adapt their maintenance regime or pivot units among subgroups and thereby tailoring maintenance to a unit’s needs.
The project targeted the crucial balance of reducing annually amortised locomotive costs and increasing locomotive availability, versus potentially increasing the failure rate. To do this, a specific approach was defined, analysing the locomotive’s usage and maintenance patterns, understanding the impact of these patterns on the risk of failure and using these insights to optimise the revision planning and capture insights on failure frequency and reasons for failure.
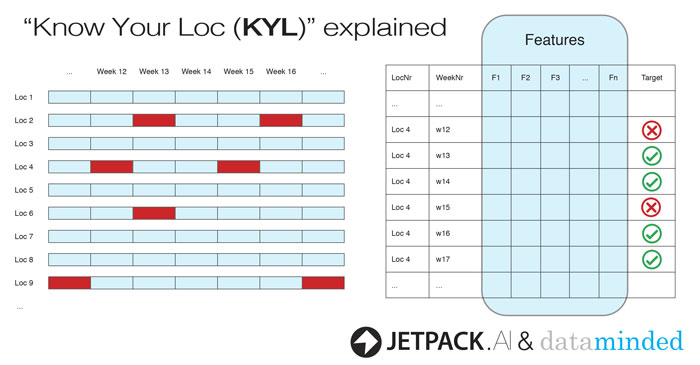
Lineas started linking usage to failure with ‘machine learning’. This approach allowed the collection of all historical data at a daily and at locomotive level. Based on this data a ‘Know Your Locomotive’ (KYL) model was elaborated. By having information on every week in the lifetime of every locomotive and by tagging the weeks where a failure occurred (target), a model to predict a week with failure was built. After looking at the variables picked by the model and their importance, Lineas could derive insights from the relation between variable and failures.
‘Know Your Locomotive’ (KYL) dashboard
The KYL model was translated into a visual dashboard. The dashboard integrates the usage, failures and maintenance using intelligent 360° visualisation. To detail the usage, different operational states, as well as the performance in these states, are tracked.
The ‘Know Your Locomotive’ model
For maintenance, the number of inspections, interventions, revisions, failures and their respective counters are visualised. On a regional level, the total amount of days in a respective region, as well as the frequency of switching between regions, is tracked. This, combined with the age of the locomotives, the total kilometres ran, and the engine hours, allows a true 360° view on the locomotive. A total of 500 features that describe the past usage and maintenance of each individual locomotive at any moment of their history were used. This results in the most complete view on the individual units and an understanding of a common pattern or behaviour that explains the failure situation.
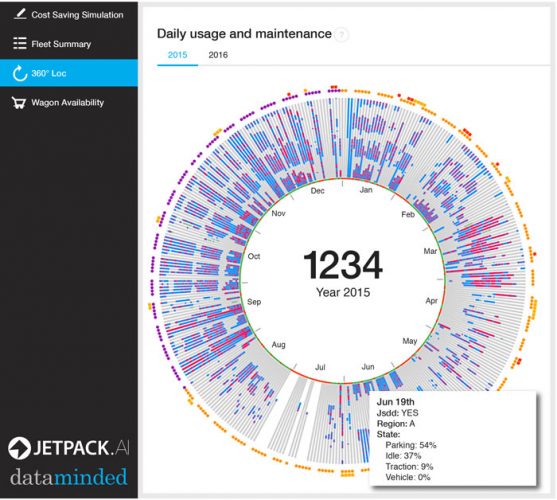
The ‘Know Your Locomotive’ intelligent 360° visual
Conclusions and how to act
A predictive model was created using state-of-the-art machine learning algorithms. The method that led to the best results was based on a distributed random forest implementation. An interesting advantage of the model used is its explicative power, for instance, it assigns an importance measure to the features. This yields an indication of which features are the most correlated to a failure situation.
The analysis provided clear evidence that humidity, and not temperature, significantly increases the risk of failure. We also found out that locomotives which have encountered a lot of issues during the last year and which have been repaired, will be more likely to face other problems in the future. And we found out that the risk of failure increases if a unit is only sporadically used.
When restricting the model to the maintenance features to highlight links between maintenance interventions and subsequent failures, the best model mainly selects the longer-term metrics as predictive metrics. The longer-term metrics have been computed on windows of either six or 12 months (for example, a year since last revision). This indicates that maintenance on this fleet influences the possibility of a failure only to a limited extent and in the long run when clearly extending maintenance cycles.
Restricting the model to the usage features, the best model selects the shorter-term metrics that are computed on windows of one or two weeks. This indicates that usage has a short-term effect on the possibility of a failure at a given moment of time and that failures can be forecasted depending on the usage.
Both conclusions are relevant from an asset owner perspective, but even more in a vertically integrated railway operator like Lineas. The maintenance conclusions are a point of discussion with the maintenance provider, focused at improving the maintenance plan, while the usage conclusion is a point of discussion with the operational departments of Lineas tailoring the usage conditions to the asset.
Data and IoT: The way forward
Lineas has equipped its fleet of locomotives with sensor devices, reading out the most important information from the locomotives and sending this data over the air. For its wagons, Lineas is following a similar track and equips wagons with telematic devices from different providers. However, for us, the Internet of Things (IoT) does not stop there. As for the locomotives, even prior to equipping its wagons with sensor devices, Lineas has used data analytics to calculate and forecast the kilometres wagons run and to create a usage pattern of its steel wagons (including number of (un)loading cycles, frequency rate of exposure to potential shocks and so on).
Combining data from different sources, creating training and testing sets, embedding data analytics in the key processes has increased the knowledge about wagons and locomotives to a major extent. The return on investment of these sensing devices can easily be calculated solely on the impact on maintenance costs. However, it is key to also consider the future effects when this data is fully integrated in the operational value chain of a railway operator. The same data capture, processed and stored for maintenance, will be a valuable source of information for the GXN customers requesting transparency on their supply chain. Looking further ahead, the same tools can be used to quickly exchange assets between railway operators without complex contracting or hand-over protocols, for micro payments between operators and clients when using wagons or locomotives and so on. The future will be all about data and we need the fleet – even if the average age is far above 10 years – to be ready.
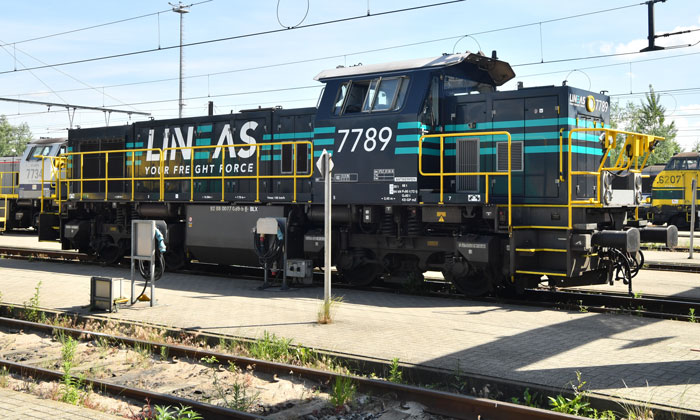
On-board data and sensors provide optimised asset management solutions
Acknowledgement
Thanks go to the team members of the Lineas asset management organisation for contributing this article. The organisation was set up in 2013 with an aim to focus on reducing the Lifecycle Costs (LCC) of its owned assets, guaranteeing flexible access, increasing the polyvalence and defining the fleet of the future. This organisation is not set up as a standalone business unit operating in a leasing company style, nor as the typical integrated fleet management organisation, but focusses on holistic optimisation as asset owner, Entity in Charge of Maintenance (ECM), fleet manager, railway operator and for specific cases, maintenance provider. By doing so, Lineas maximises both the return of its assets, as well as the value proposition towards clients of its GXN. The team is led by Jeroen Spruyt.
Issue
Related topics
Cargo, Freight & Heavy-Haul, Digitalisation, Technology & Software