How will railroad freight be affected if the annual U.S. GDP growth breaks the three per cent mark?
Posted: 17 July 2018 | Petr Ledvina - Railroad Tie Association | No comments yet
Petr Ledvina, Economist at the Railroad Tie Association (RTA) writes that an increase in U.S. railroad freight traffic is likely should the country’s annual GDP growth break the three per cent mark.
For the first quarter of 2018, the U.S. economy had solid GDP growth and headline unemployment was the lowest in many years. Commodities prices have recovered and inflation is rising to the two per cent target.
In addition, personal income is increasing. There are expectations that the FED will make two or three further rate hikes this year. Also, GDP should rise above three per cent in the second and third quarters. Besides the tensions in trade relations, there is almost nothing not to like in the overall economy. This growth should also increase railroad freight traffic.
Still, there are some headwinds coming. Even though annual GDP growth above three per cent on a sustainable basis is desirable, some evidence may not support this.
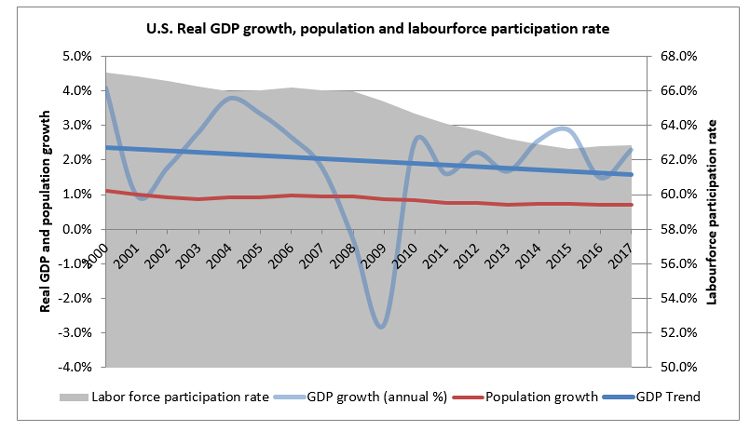
Figure 1
Credit: World Bank
On the supply side, U.S. GDP depends on, among other things, population growth. Between 1960 and 2000, the annual population growth was relatively strong at 1.1 per cent on average. For the same time frame, GDP grew 3.6 per cent on average. However, in the last 17 years, population growth slowed to an average rate of 0.8 per cent. Similarly, economic growth slowed to 1.8 per cent on average. In addition, the labour force participation rate declined measurably, as displayed in Figure 1. This is not just the case in the U.S. Other nations, like Japan, are experiencing similar declines in population and GDP growth. The decline in labour participation has been partially substituted by labour productivity. The long-term average of productivity growth in the U.S. is 2.2 per cent. Yet, since 2007, the average has been only one per cent (BLS), thus not contributing to GDP growth as in the past.
How is the demand side of GDP? Disposable personal income has grown 17 per cent in the last 10 years. Of late, the growth in personal income has not been evenly distributed among households and wages have been relatively stagnant when adjusted for inflation. A study by the New York FED shows that on average, 60 per cent of households had anaemic growth in their real disposable income, illustrated in Table 1.
It is generally agreed that consumer spending accounts for about 70 per cent of the GDP in the U.S. Higher earners though, have a lower marginal propensity to consume goods and services. That is, for any additional dollar earned, they tend to consume less and save more, in the form of bonds and equities, for example.
Another factor is that the U.S. population is heavily indebted as compared to income (see Figure 2). As a result, many consumers have not been able to take full advantage of the low interest rate environment to borrow, as they did during previous recoveries. Thus, expectations for the consumer to step up spending further may not be realistic. Of course, personal tax cuts may help. But, unless there is evidence of progress in real wage increases, consumer-spending growth may remain relatively subdued. Nonetheless, recent increase in economic activity will provide some positive lift in rail freight traffic.
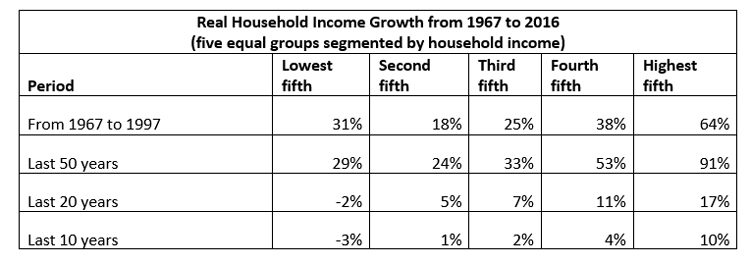
Table 1
Credit: U.S.Census Bureau
One freight sector that can’t be predicted at this time to be positive for railroads is coal. In 2017, coal production increased by 6.2 per cent, substantially helped by coal exports, in spite of U.S. energy-related coal consumption being the lowest since 1982. It is not only low natural gas prices that drive this trend. Since 2000, improvements in the efficiency of the natural gas-fired power sector increased significantly due to implementation of the combined-cycle generator, portrayed in Figure 3. This process re-routes the waste heat from the gas turbine into a nearby steam turbine for extra power generation.
Also, overall electricity generation shows a declining trend. Since 2007, U.S. net production of electricity declined by 3.7 per cent. This is a rather surprising finding. The likely reasons are the shift from goods production to services, plus more efficient appliances, more efficient light bulbs and more people living in apartment buildings, which have fewer outside walls than do houses. EIA projections do not suggest any shift from current trends. In addition, exports of coal are also projected to decline in the coming year and a half.
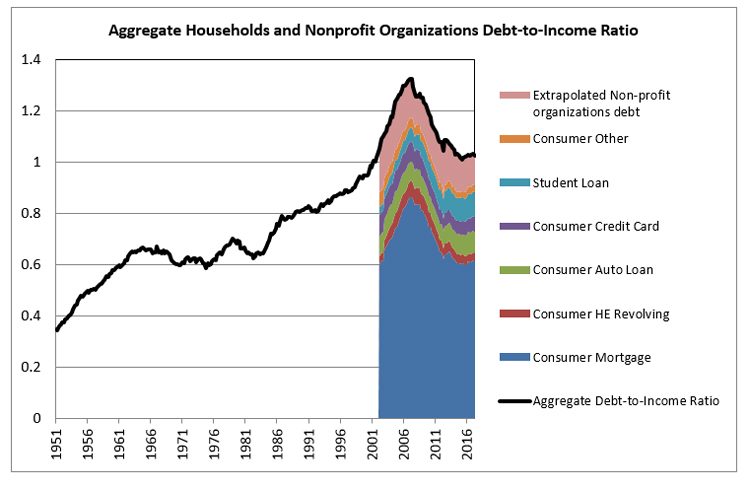
Figure 2
Credit: FED of New York and Financial Accounts of the United States
However, there are some proposals of the administration that could, if implemented, change the outlook for coal significantly. As reported by Reuters and other news agencies, there is a working document in which the administration contemplates intervention in the energy market. In this directive, fulfilling its promises to the coal sector, the transmission lines would have to buy power from coal-fired power plants as a first choice for two years. In conjunction with recently-imposed tariffs on steel and aluminium imports, this could lead to a significant increase in the demand for coal and coke.
Combining these outlooks, our railroad tie demand forecast for 2018 has not changed much since January. We also, in Table 2, present a new forecast for 2019, However, before we review the results of the econometric model, an explanation is in order.
In January 2018, we forecast total tie purchases to be 22,508 for the year 2017. The actual number was 23,832. This was a 5.9 per cent miss, yet almost within forecasting statistical error range.
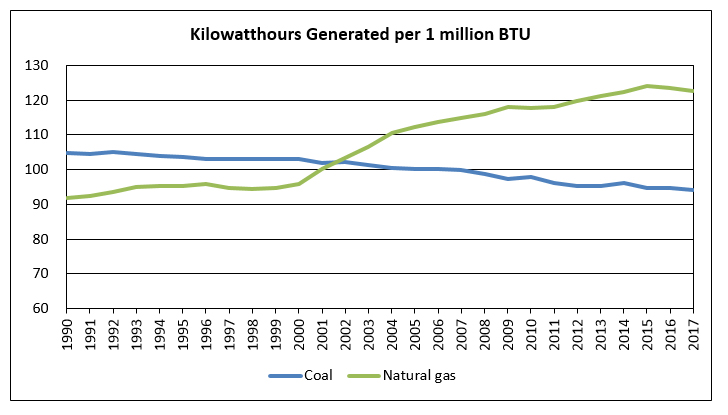
Figure 3
Credit: Energy Information Administration
What caused the discrepancy?
While the model performed well for the Class 1 railroad purchases, where the difference was only 0.3 per cent, it underestimated the small market by 19 per cent. While good and consistent data, plus excellent support from AAR for Class 1 railroads exists, the small market is very fragmented and consistent quality data is hard to come by.
Recent forecasting work has concentrated on that section of the market, resulting in an overhaul of the econometric equations. As shown in Table 2, railroad tie purchases declined in 2017 and are expected to weaken further in the current year; this weakness manifests in both Class 1 railroads and short-lines; however, 2019 is predicted to bring positive growth in railroad tie demand.
On a purely speculative note, actual railroad tie purchases for 2018 and 2019 may ultimately be affected by a looming problem on the supply-side of the equation. RTA reported Inventory to Sales Ratio (ISR) has plummeted throughout 2018. While the model generates a fundamental economic case for demand, it cannot be expected to account for certain ‘live’ marketplace factors that could negatively impact actual purchases.
Should this occur, one could expect, as in the past, that pent-up demand could carry forward into future years.
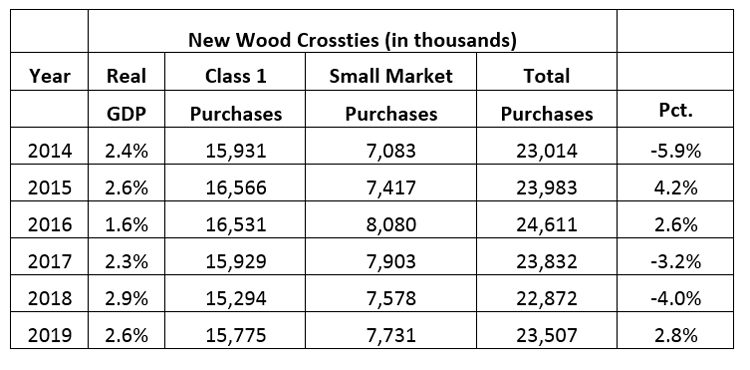
Table 2
Biography
 Petr Ledvina has been a member of the RTA economic forecast team since 2014. Born in former Czechoslovakia, he has a background in electrical and civil engineering and has worked on railroad maintenance for two years. Petr earned a Degree in Economics at Birmingham-Southern College and his current professional work includes financial analysis and data modelling.