The benefits of implementing BIM on the EOLE project
Posted: 25 October 2022 | Léa Loucas | No comments yet
Léa Loucas, BIM Manager at SNCF Réseau, explains how Building Information Modelling (BIM) has been used within the EOLE railway infrastructure project, and how this tool has helped to identify ‘clashes’ and avoid expensive problems.

EOLE is a very complex railway infrastructure project, with a budget of several billion euros. It concerns the extension of the ‘RER E’ train line to the west of Paris, which includes 56km of redesigned tracks and 42 operations to be commissioned in four years. It will benefit nearly nine million passengers a day, with 400 trains that will be circulating on the line every day. The difficulty lies in the fact that the site works are taking place whilst operations are in service. The phasing is also very complex, and the infrastructure is highly dense.
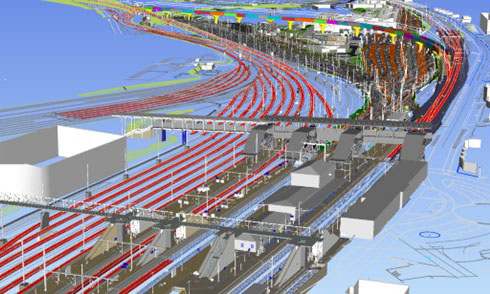
Figure 1: View extraction from the global federated model of the EOLE project.
The part of the project that is being managed using Building Information Modelling (BIM) is 10km long. The global model is composed of 300 models, 13,000 objects and 31 sub-projects. Thirty-three per cent of the clashes are being detected using BIM, but this number is not quite accurate because, at first, our model was not at a sufficiently advanced stage to let us detect the clashes using it, and this number takes into consideration clash detection since the beginning of the project. So, this number is increasing as the model is becoming more elaborate. A multitude of companies are producing BIM models for the EOLE project, with approximately 190 people who are directly involved in producing models of diversified disciplines, such as tracks, signalling and catenary.
The main reason why we decided to use the BIM approach was to identify the clashes more effectively than how we used to do so previously. The following example shows how modelling signals can have a major impact on catenary design.
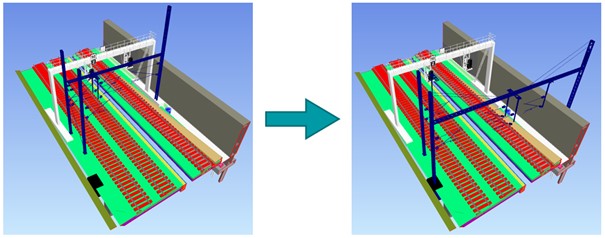
Figure 2: Example of a signal visibility problem detected using BIM models, and the suggested solution.
Figure 2 shows a catenary gantry (shown in blue), which is obstructing the visibility of the signals that are just behind it (shown in white). This visibility problem was detected using the BIM model, just three days before the site works. So, the catenary design studies were rechecked, and the gantry has been moved, as we can see on the second picture, to avoid masking the signals which will be installed in two years. If we hadn’t detected this issue in time, we would have installed the catenary gantry and then we would have had to move it again, which would have been very expensive. So, this is just one example among more than 200 clashes that we have detected using the model, and which are currently being treated.
What about the process?
To succeed clash detection and management, things need to be structured. I am not going to detail the whole process; instead I will break it down into the main steps.
First, we need to fix a common goal, and according to the chosen goal, we start defining the models’ requirements not just in terms of geometry modelling and level of details, but also in terms of information level. At this stage, a workflow is established, a common data environment is created and rules are set. It is important that each person working on the project feels concerned and respects the tasks which are assigned to them. For example, some will be producing the models, while others will check them to make sure they are compliant to the defined requirements. If so, the separate models are added to the global one, and if not, adjustments should be done. Following this, we can start the clash detection. In reality, the process doesn’t occur in such a linear way, because we get new models throughout the project.
As a first experience of clash detection on the EOLE project, we tried using a clash matrix, but the tests were not that conclusive as the process was very time consuming and not effective enough. We had more than 6,000 clashes detected at once, some of which were not rational ones, but just automatically detected. Obviously, we didn’t have time to go through all of them, which is why we came up with another method more tailored to our needs. Currently, every time we receive a new model, we add it to the global one, considering that the latter is reliable and clash the two of them together. In this way, we can measure the impact of this newly received model on all the rest.
The main reason why we decided to use the BIM approach was to identify the clashes more effectively than how we used to do so previously.
Afterwards, we list all the clashes in a single file, which becomes our main management tool. For each clash detected, we fill the important information about its location, the disciplines concerned, the coordinator who will be in charge of it, and we illustrate it with a screenshot. This allows us to follow-up on the clashes till the moment they are solved. We also make sure to keep track of the suggested solutions. One thing that is good about this tool is its simplicity and user friendliness. Anyone can easily use it, even people who aren’t trained to use specific model analysis software.
In the field of railway engineering, the signals’ visibility is a major and fundamental concern. In such a rich and complex environment as we have on the EOLE project, signals could easily be masked by another element. That’s why making sure that they are visible before implementing them on site is very important safety-wise.
On the EOLE project, we use three different methods to analyse signals’ visibility: the static views, the dynamic method, and the visibility cones. I am not going to dwell on the first one, as it just consists of positioning ourselves at a random place of the global model and analysing what we can see.
The dynamic method consists of creating a simulation of what the train’s driver can see while approaching the signal (the driver usually needs to see the signal clearly from 100m, 200m or 300m ahead of it, depending on the trains’ speed). Using this method, we can do virtual and anticipated site tours, which are revolutionary in the field of railway engineering.
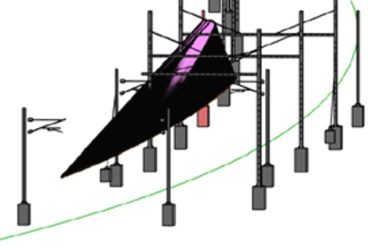
Figure 3: Visibility cone: a fictive 3D model representing the specific area of the driver’s field of view that needs to be clear.
The third method is a mathematical and objective one. It consists of creating a fictive 3D object which represents the specific area of the driver’s field of view that needs to be clear. Using this object, we can do a clash detection to see where other elements are interfering with this area. We have created as many cones of visibility as the different types of signals that we have.
To create them, we need to take into consideration the following settings:
- The train’s speed, which allows us to know the signal needs to be visible from 100m, 200m or 300m ahead of it)
- The track’s axis, which gives extra indication about the positioning
- The driver’s eyeline, which gives extra indication about the height (it is directly related to sitting or standing position)
- The signal’s shape, as we need to integrate a visibility circle at the centre of it.
These settings are also useful for the dynamic method.
At the beginning of this article, I explained how we use BIM on the design phase of the EOLE project. At first, we started with one main use case, which is clash detection, but with the openness that BIM has given us, we ended up with several secondary ones, which makes BIM a huge success of the EOLE project. Now we also use BIM and augmented reality onsite and we are trying to find complementary uses of augmented reality in the design phase.
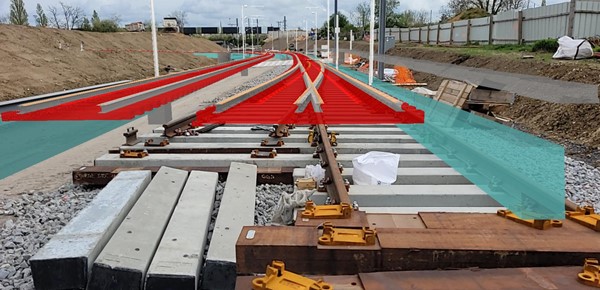
Figure 4: Overlay of existing environment and future tracks and catenary (view extracted from the augmented reality tool).
What we are trying to do is adapt the methods to all the participants, since each entity working on the project has different problems and needs.
Having one single global model, which is updated regularly and includes all the models produced internally and those that are outsourced, enables us to identify the clashes more easily and earlier, allowing us to start the adjustments much sooner. Therefore, BIM enables us to make the studies more reliable. We save time and money, especially for signalling, where BIM has become an essential part of the process on the EOLE project.
The means put in place on the EOLE project have allowed exceptional results, which has given a new impetus to using BIM on various projects at SNCF Réseau. The key to success is to adapt the BIM approach to the project’s needs and budget.
 Léa Loucas is a French Lebanese Architect and BIM Manager. She grew up in Lebanon, where she graduated in 2017 from the prestigious architecture school “Académie Libanaise des Beaux Arts” (ALBA). She got her master’s degree with distinction and received several awards for her graduation project, including an award from the ‘Order of Architects and Engineers of Lebanon’. Léa has been living in France for almost five years now. When she first came to France, she started working in the field of architecture, before deciding to go back to studying. A master’s degree in BIM Management particularly caught her attention, as she understood the importance of BIM in the construction field and the diversity of the opportunities it could offer to her professional career. As a part of her master’s degree at the CESI engineering school of Strasbourg, she wrote a professional thesis about the “BIM mutation of a railway design office”, which was particularly appreciated by different entities at SNCF Réseau. Léa has been working for SNCF Réseau for more than two years now, as a BIM Manager and Head of a BIM and 2D Synthesis Unit, in charge of the design phase of the EOLE project.
Related topics
Augmented Reality (AR), Big Data, Building Information Modelling (BIM), Digitalisation, Funding & Finance, Infrastructure Developments, Operational Performance, Regulation & Legislation, Safety, Signalling, Control & Communications, Technology & Software