Applying data science to predict track degradation
Posted: 13 September 2022 | Douwe Treurniet | No comments yet
Douwe Treurniet, Product Owner Asset Degradation at ProRail, discusses the concept of applying data science to predict track degradation in order to support the planning process and mitigate risks. With this prediction, better technical and financial decisions can be made that lead to cost savings and risk mitigation in the planning process of ProRail’s track renewal programmes.
ProRail is responsible for the entire rail network in the Netherlands: its construction, maintenance, management, and safety. As an independent party, ProRail distributes the available rail capacity among the various operators, regulates all train traffic, builds and manages stations, and lays new tracks. In addition, ProRail maintains existing tracks, switches, signals, and level crossings. All this makes it possible to transport 15.2 billion passengers and 42 million tonnes of goods in the Netherlands every year.
ProRail connects people, cities, and companies by rail and will continue to do so in the future. We make travelling pleasant, and we enable sustainable transport. Every day, we enable a million journeys and more than 100,000 tonnes of goods to reach their destination by train via our tracks, which span more than 7,000 kilometres.
Facilitating growth
In the Netherlands, we expect to see growth of approximately 30 per cent (by 2030) in both the number of passengers and goods being transported via our rail network. We want to facilitate this growth in a sustainable way.
ProRail is expected to provide the financial requirements and plans for the maintenance of the rail network 15 to 20 years in advance. We draw up these long-term plans based on the current configuration of our rail network in combination with theoretical lifespans. The theoretical lifespans are defined in our continuity policy. The expected year of replacement is calculated by adding the theoretical lifespan to the year of installation. A drawback of this methodology is that assets may be replaced earlier than technically necessary.
ProRail is constantly looking for ways to improve the maintenance of its assets and its processes as a railway management company. In order to achieve this, it is necessary to be able to know, at all times, where assets are located and what their condition is. To achieve this we use the latest technology in our network, such as image recognition algorithms and smart sensors.
In the past and present, having high-quality insight into the location and condition of our railway network has opened up the possibility of looking ahead and working more proactively. We have set up a programme to be able to better predict asset replacements and to gain improved insight into the financial forecasts. This programme is called Asset Degradation Long Term (ADLT). ADLT develops and delivers data‑based replacement forecasts based on existing replacement policy. In addition to the assessment of tracks, we also examine the potential of AI for monitoring other assets such as sleepers, ballast, switches, and switch components. ADLT assesses the relationship between replacements due to different factors, such as train speed, loads and passages. This will help us understand the impact of increasing transport volume on our needs for replacement of assets. This will also improve the understanding of the financial resources required for this purpose.
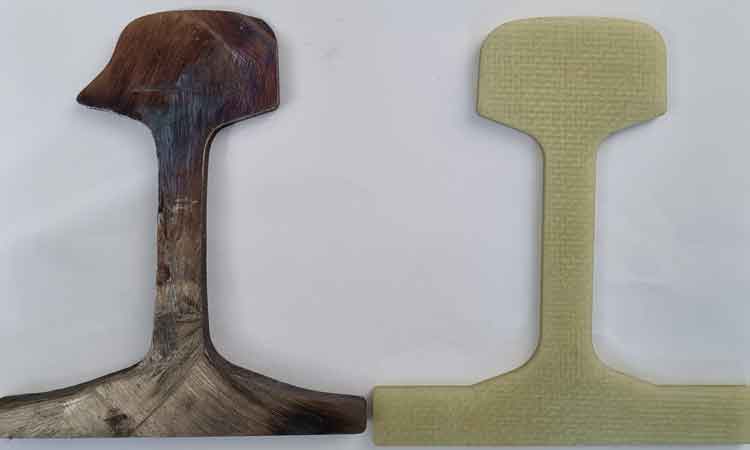
Figure 1: Head wear of a track.
Monitoring and maintaining tracks
ProRail replaces approximately 200 kilometres of tracks every year. Tracks are critical and capital-intensive assets to ProRail as an asset manager and it is important that these assets are performing at their best and that they are used in a sustainable manner.
When drawing up forecasts, it is important that a uniform replacement policy is established. It is our policy to replace tracks if the horizontal or vertical wear of the head exceeds a standard value (in millimetres). An important advantage of the head wear parameter is that this replacement indicator is an objectively measured value. We have been measuring and saving this parameter in a structured way since 2009. Twice a year, a measurement campaign of the vast majority of our rail network is loaded into our systems. This is why we saw a lot of potential for tracks in the research into the possibilities of using AI for replacement predictions.
With the decision to choose tracks and data sets to develop models, we started to experiment with the drawing up of proof-of-concepts.
After this phase, we further developed the model for track replacements using pilots. This model is now structurally available, and it is currently being used, among other things, to provide our specialists with information in their planning process.
The model predicts horizontal and vertical head wear on tracks. The algorithm works on the basis of multiple linear regression. It makes a prediction for the year in which the tracks will need to be replaced, based on more than 90 million data points. These predictions are initially drawn up for every three metres of our main railway network.
In order to meet the ultimate needs of our client, we have also developed an algorithm that simulates the first steps of the current planning activities. This means that we combine the predictions for sections of three metres and convert them into better units for replacements with a length of at least 50 metres. This results in forecasts in workable lengths for use in our planning process.
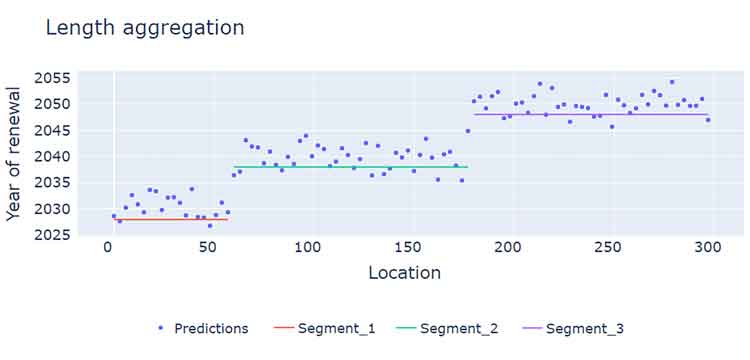
Figure 2: Representation of the segmentation algorithm to create replacement sections of at least 50 metres.
We were able to achieve this through frequent interaction with subject matter experts in our organisation. Together with these track experts, we have compiled a list of more than 40 factors that affect head wear to a greater or lesser extent. These include historical wear measurements, replacement of objects, axle loads, loads, and track material types. From this, we defined 13 significant factors which were taken into consideration as ‘features’ in the modelling. The short communication lines with end users and subject matter experts have been of great importance for the accuracy and adoption of the forecasts.
Using data to analyse trends
To be able to predict long-term replacements in the future, it is necessary to identify past trends. The basis for this is the availability of historical data in a way that it can be used for trend analysis. For this it is important that a history of data is available for a period that is as long as possible.
We measure the track geometry of our main rail network twice a year. This data is saved in our monitoring system, BBMS. As a result, we have the geometric data of track profiles available for every three metres of our main rail network since 2009. Having historical configuration data and condition data has been one of the most important enablers for investigating the possibility of head wear predictions.
Data is not immediately the same as information. The data used comes from different data sources, each serving a different purpose within the organisation. Therefore, we had to look carefully at the purpose for which this data was collected, and the accuracy of the data required for that purpose. In order to classify a data source as useful, the quality of the data needs to be assessed. The quality of a single data source may vary depending on the purpose for which it is used. An example of this is the accuracy of the measurement. The accuracy will be different for defining a lower limit overrun than for a trend analysis. This has yielded a wide variety of datasets that needed to be linked together.
We use a Big Data Analytics Platform (BDAP), specially designed by and for us, for processing these data volumes. This platform is used for the development of algorithms, the processing of large amounts of data, and for complex and heavy‑load calculations. This cloud environment was developed in collaboration with the market in order to accelerate the development of Proof of Concepts that can be scaled up into a mature product. This allows us to quickly access compute resources and link to data sources.
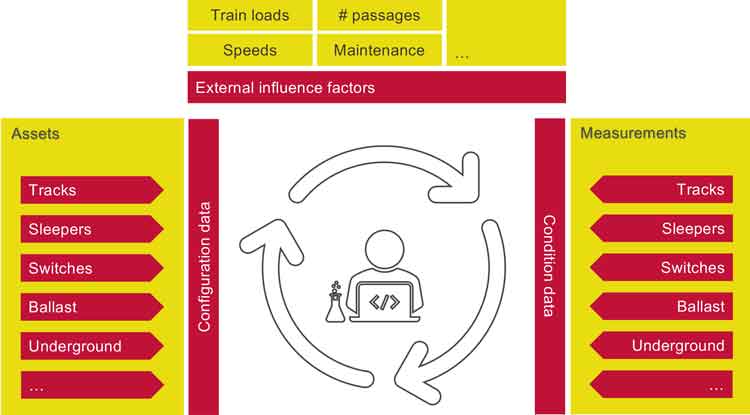
Figure 3: Way of working for the Asset Degradation team (ADLT).
The head wear model of ADLT has several advantages compared to the theoretical life‑span method. The strength of this model is that it uses as much information as possible to predict head wear.
The main advantages of this model compared to the conventional method are:
Historical data
The model is trained using historical data, which is supplemented with every measurement campaign. This allows the model to recognise wear patterns. In addition, the model will automatically incorporate any changing wear patterns resulting from changing policy choices (e.g., more frequent grinding, new type of track, etc.).
Track characteristics
Specific characteristics of the track are included, such as track profile, maximum speed, and the curvature/superelevation of a spot on the track. This allows different wear patterns to be identified for specific types and situations.
Specific use data
The model uses historical use data and estimates of future loads. This means that the lifespan can also be estimated based on different load scenarios over time.
Updates of forecasts
All forecasts will be retrained and tested and drawn up again after each measurement campaign. This means that all forecasts will immediately be updated with all new information available from the latest measurement campaign.
Changes in load in past periods, which may result in faster, slower, or increased wear, will automatically be included by the model. An example of this is the period of the COVID-19 pandemic, during which the rail network was used a lot less. This results in an adjustment of the forecast of when the replacement value will be reached. This keeps the data up‑to‑date at all times and surprises in the replacement planning are avoided.
Challenges ahead
Transferring such complex algorithms to our internal management teams turned out to be a challenge. This is because the quite specific knowledge and skills required for the models is not present. Within this programme, we have opted to work in a DevOps set-up. This is because development and operations are the responsibility of a single team, so the team can ensure faster Continuous Integration & Continuous Delivery (CI-CD). DevOps is a comparatively new way of collaborating for ProRail. ADLT develops predictive models (Dev) and delivers structural solutions (Ops).
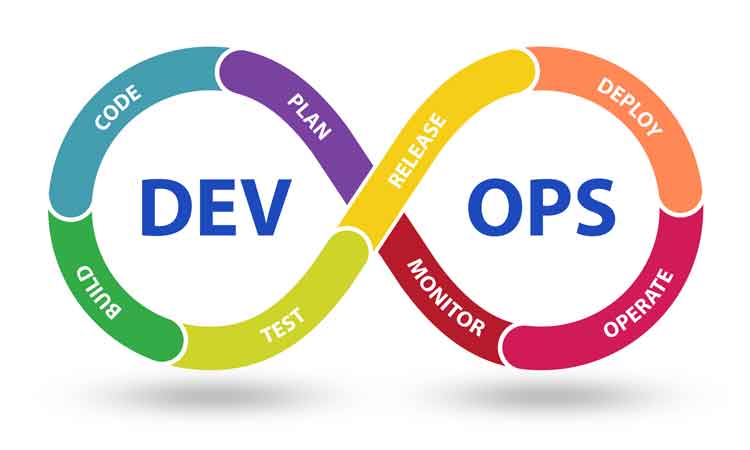
Figure 1: The DevOps working cycle.
The challenge is to balance the innovative development with further professionalisation of the solution already implemented. We have opted for this approach because we need to have fewer transfer moments to achieve a mature solution. It also makes organising further development easier. We have found that this makes transferring knowledge and backgrounds of the complex models and data structures less prone to deterioration.
We now create a verified and adopted forecast of head wear and track replacements based on condition data and information. This allows us to differentiate the assessment based on different characteristics. These assessments can also be used in different transport growth scenarios. For this we actively use advanced analytic techniques and the latest technologies.
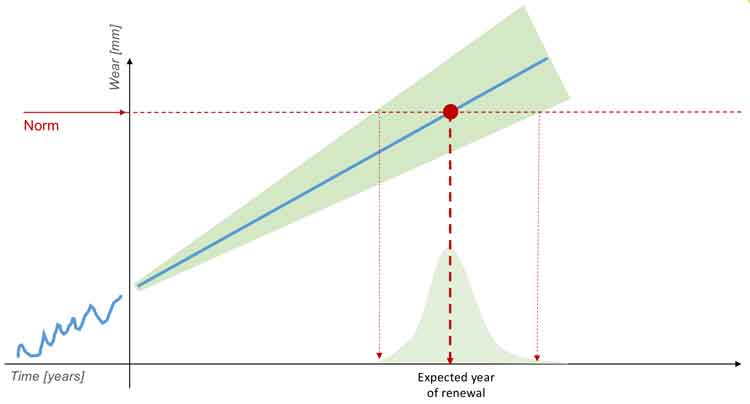
Figure 5: Predicting track renewal
This has changed the way we work, and we have been able to use a growth path to effectively utilise artificial intelligence (AI) in our operational processes. AI in the rail sector is a given, and it will help us to make more effective, safer, and more sustainable rail transport possible.
 Douwe Treurniet has over 10 years of experience in advanced analytics, mostly in asset management and factual decision making for capital intensive industries and assets. As a data and innovation specialist, he has worked on commercial data platforms and advanced analytics programmes in the maritime and rail sector. He has been dedicated to showing and applying the potential of algorithms and data in order to make complex capital decisions and mitigate risks for complex and capital‑intensive assets.
Issue
Related topics
Artificial Intelligence (AI), Coronavirus/COVID-19, Digitalisation, Infrastructure Developments, Track/Infrastructure Maintenance & Engineering