Train braking performance determination
Posted: 31 May 2005 | | No comments yet
During their historical development, the railways in Europe have adopted their own technical standards and operating rules according to national requirements. As a result, the European railways use different train control systems (INDUSI, KVB, LZB, TVM, ATB etc.) and have different warning distances (400m to 6,000m). This situation constitutes a serious obstacle for interoperable high speed and conventional trains. To overcome this obstacle, the ERTMS/ETCS standard European train control system was developed.
The ‘Specifications for the braking deceleration of trains for ETCS/ERTMS’ Project aims to ensure the interoperability as defined in Directives 96/48/EC and 2001/16/EC with respect to interoperability of the trans-European high speed and conventional rail system.
Braked weight percentage
Currently, for virtually all trains in Europe operating at up to 200km/h, the only information available for the quantitative description of the braking performance is the braked weight percentage. The braked weight is usually determined empirically on the basis of stopping distances obtained in tests (according to UIC Leaflet 544-1).
In 1938, the French engineer Pedeluc from PLM (Chemins de Fer Paris-Lyon-Mediterranée) performed a series of braking tests using 15 identical passenger coaches by applying an emergency brake from different initial speeds. He defined the mass of every vehicle as its ‘braked weight’ and called the quotient of ‘braked weight’ and vehicle mass the ‘braked weight percentage’ (or l-value).
As a result that (standard) test train had a nominal λ-value of 100%. Different train masses were simulated by simply switching off the brakes of one or more vehicles on the assumption that the λ-value is constant. As the total mass of the train remains unchanged, but the mass of the vehicles contributing to the braking performance decreases, it was possible to generate graphs of stopping distances for each initial speed.
On the basis of the test results he developed graphs for each initial speed to relate the three parameters of stopping distance, initial speed and λ-value with each other. This allowed the evaluation of the braking performance of a given train on the basis of its stopping distance.
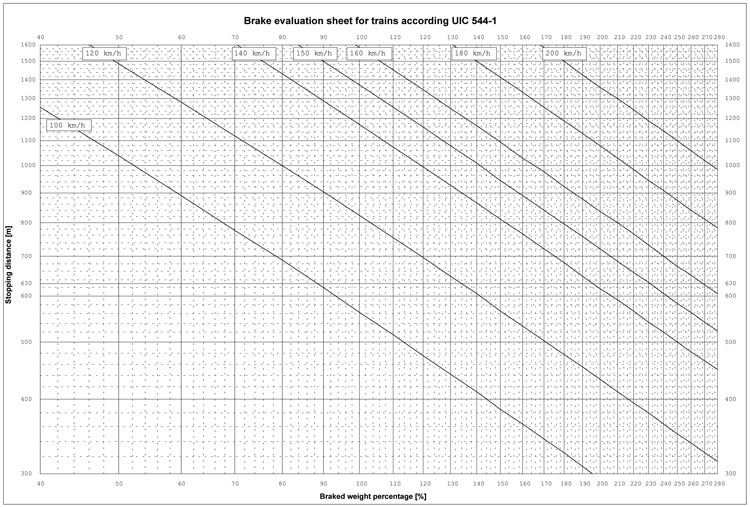
Figure 1: Brake evaluation sheet for trains according to UIC-Leaflet 544-1
In a double logarithmical scale these graphs appear as straight lines allowing an easy assessment of any train’s braking performance (see Figure 1). A similar method called slip-brake tests was used to create graphs for individual vehicles (see Figure 2). To obtain a vehicle’s (or a train’s) ‘braked mass’ it is sufficient to multiply the λ-value find as a test result with the vehicle (train) mass. The established value is independent for all initial speeds (however this is only correct for cast iron friction material).
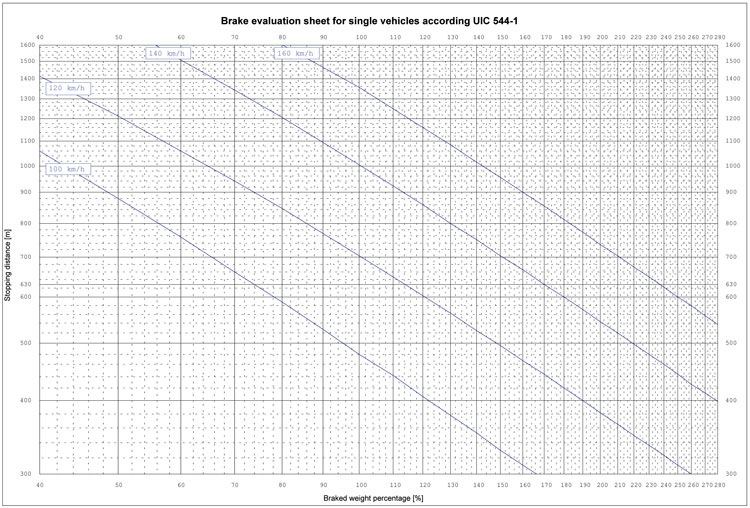
Figure 2: Brake evaluation sheet for individual vehicles according to UIC-Leaflet 544-1
Consequently, brake tables were developed by each railway defining the required λ as a function of the braking (and consequently signalling) distance to operate a train at a given speed or vice-versa to determine the maximum speed for a given λ-value.
This system has been adopted by nearly all European railways as the calculation of the braking performance was easy, by simply adding vehicles’ masses and vehicles’ braked weight and dividing the two values. It is an effective way of expressing the ability of any train to stop over a certain distance when travelling at a given initial speed. However, this parameter does not provide any information on the actual deceleration characteristics, which can vary widely depending on the braking equipment.
The above characteristics indicate that it will still be important in the future to ensure that the braking performance of trains can be described predominantly in terms of the braked weight percentage.
Train braking with conventional signalling
In the case of conventional signalling, where information is provided by lateral trackside signals, in theory there is one point at the beginning (warning signal) and one point at the end (stop signal) which must be observed. Between these two points the profile of the train’s deceleration is generally not subject to control and depends on the type of brake with which the train is equipped.
An automatic speed supervision system like ERTMS/ETCS (see Figure 3) requires knowledge of the braking performance of a train in the form of its instantaneous deceleration as a function of speed. Clearly, a solution therefore had to be found to use the braked-weight percentage, l (and, if necessary, other additional information), to derive a reliable deceleration profile.
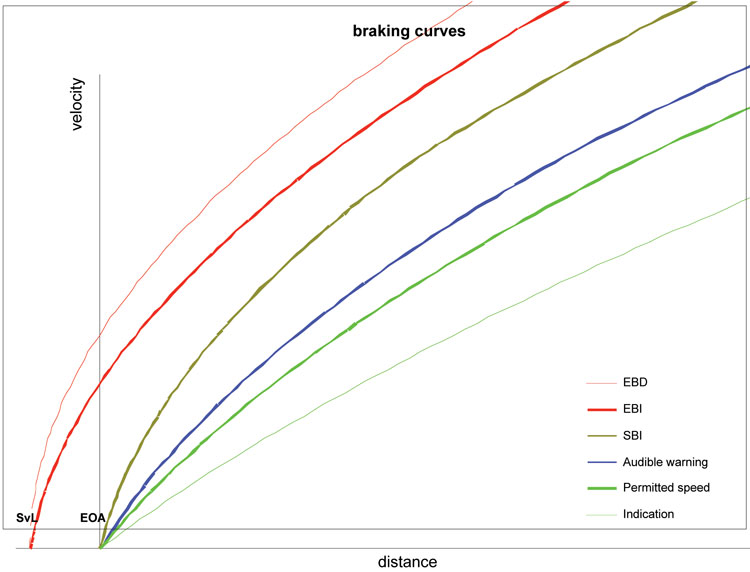
Figure 3: Deceleration curves for ETCS
Methods for calculating instantaneous braking decelerations
As a consequence, a new method to describe the braking performance of all train categories running in an ERTMS/ETCS environment had to be developed. Emergency braking curves are necessary for safety. As timetables are never based on emergency brake applications, but on service braking, line capacity is limited by service braking curves. To achieve an increase in line capacity, a definition of standardised service braking curves will be essential for the performance of the system.
Three different mathematical models were developed to translate the l-value into an instantaneous deceleration function. These models were all based on different theories:
- The FS model has a theoretical basis in certain assumptions on the properties of brake systems.
- The NS model derives decelerations from the known speed-dependency of specific types of brakes.
- The DB model is an empirical adaptation of an old UIC method used in the LZB signalling system. Unlike the FS and NS models, it does not give a result in the form of a step function for instantaneous decelerations versus speed.
All three models calculate the instantaneous braking decelerations from known train data, including the braked weight percentage.
To determine which model would best suit the requirements, results of actual brake tests, recently performed by different railways to assess the braking performance of their rolling stock, were collected. These results were compared with the values each model would calculate. In order to assess the quality of the models, the predictions they yield (for decelerations and braking distances) have been compared with a large number of experimental results (approximately 150 sets of test results). After ten months of intensive work, it was determined that the conversion model developed by FS delivered the most consistent and accurate results, calculating safe distances for all train types for which test results where available.
Due to the lack of existing test results of some important types of train combinations (e.g. freight trains with cast-iron brake blocks or passenger trains with cast-iron block brakes) it was not possible to evaluate the model for all train types. In order to test the suitability of the model in everyday service, it was necessary to perform tests on ETCS equipped lines. It was therefore decided to perform dedicated tests in a second phase with such trains to close this knowledge gap.
Although the basic suitability of the conversion model for use in ETCS was established, the existing model could not yet be recommended for immediate inclusion in the ETCS-SRS or indeed in the TSI for the time being. There are two main reasons for this:
- The braking trials on the ETCS test lines could not be carried out within the timescale planned.
- Various railways, for example SBB and DB, have stated they are not in a position to use the current model on Level 1 lines, as it generates stopping distances for certain train types that are excessive and not compatible with existing signal spacing.
The criticism of the safety margins inherent in the model, which can be seen as the principal cause of the incompatibility on Level 1 lines, is fully justified. Unfortunately, it came at a point when the Working Party no longer had sufficient time available to conduct a comprehensive optimisation of the model. It is also worth noting here that the λ-value that is currently used exclusively to describe the braking power was derived from the deceleration characteristics of grey cast-iron brake blocks.
The superior performance of disc brakes
It had already been established long ago that vehicles fitted with disc brakes have considerably improved braking performance and therefore greater safety margins at higher speeds than those with cast-iron tread brakes, in other words they achieve shorter braking distances than those specified in UIC Leaflet 544-1. All that could be done with the model to reconcile this fact (with the aim of arriving at a standard conversion model that is not linked to the type of braking equipment used) was for the model to deliver realistic deceleration values for tread-braked trains fitted with cast-iron blocks. Consequently, the deceleration values provided by the model were too conservative for disc-braked vehicles and for vehicles with additional brake components like electro-pneumatic brakes, brake-pipe emptying accelerators or magnetic track brakes.
The solution to overcome these constraints was to improve the current model by modifying some of its parameters and to re-enter the values from test results to assess the impact on the braking distance. In a final attempt, the WP evaluated different parameter modifications on the basic model for all train types, which meant a cross-check of more than 250 test results for each modification of the model.
This work was not in vain, as it turned out to be possible to generate an advanced model still applicable for all train types. The only additional parameter to be introduced is to distinguish between brake position P for passenger trains and G for freight trains, taking into account the different brake development times of the distributor valve for the two positions (3-5 seconds to achieve 95% of the maximum cylinder pressure in P compared to 18-30 seconds in brake position G). As an additional advantage the model is widely compatible with the existing brake tables used by the railways, so no additional measures will be necessary to run a train on ETCS-equipped lines as well as on a classic line with lineside signalling.
There are still open points to be dealt with, including testing the advanced model for service brake applications. Such testing can only be performed on an ETCS pilot line with a locomotive fitted with the original onboard equipment. Such tests are planned for 2005 at ÖBB. Another major issue still to be resolved is the development of standardised safety margins for ETCS-lines to avoid changing the algorithm to calculate the guaranteed deceleration at network borders.
It is to be anticipated that with the introduction of this standardised conversion model a considerable step towards the interoperability on ETCS-lines is achieved that is intended to contribute to the success of ETCS/ERTMS.
Issue
Related topics
European Rail Traffic Management System (ERTMS), European Train Control System (ETCS), Track/Infrastructure Maintenance & Engineering